
Columbus Multifamily Absorption Hits a Five-Year High as Overall Vacancy Eases: Q3 2026 Market Analysis
The Quarter in 60 Seconds
- Renters absorbed about 8,000 units over the past 12 months, the most in five years.
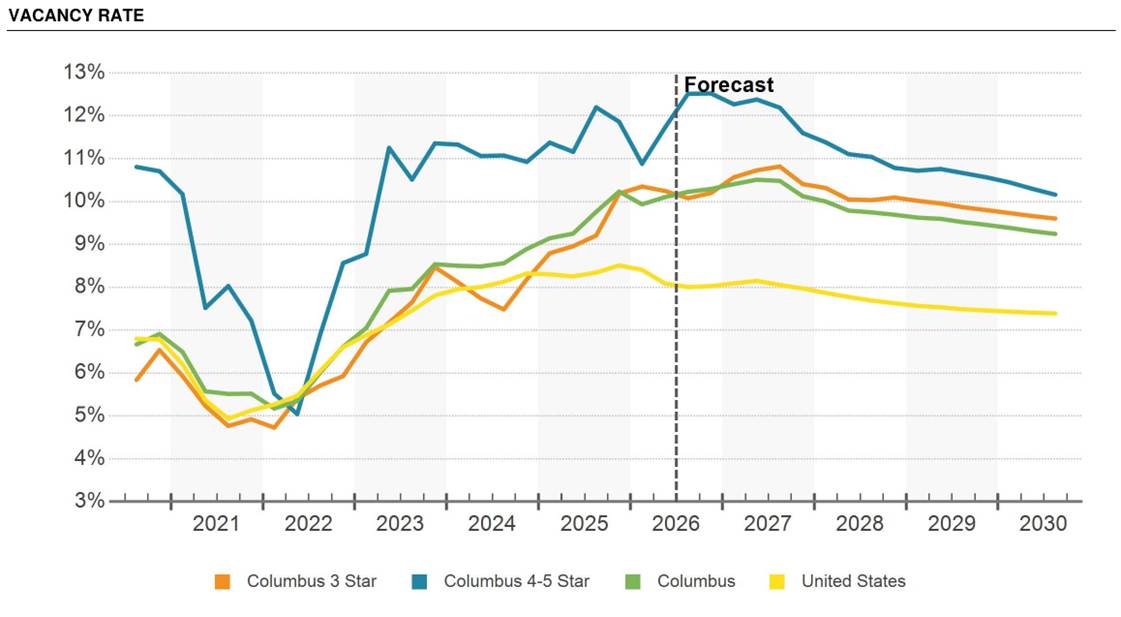
- Overall vacancy (including lease-up) eased to 10.1%. Stabilized vacancy fell to 7.7%.
- Asking rents rose 1.1%, but effective rents slipped slightly negative as concessions deepened.
- The construction pipeline shrank to about 7,300 units, and 2027 deliveries are forecast to fall 44%.
- Sales stayed thin at about $337M over 12 months. The market cap rate held at 6.8%.
Market Annual Trends
Exact figures from CoStar (data as of 9/12/2026). Past 12 Months | Historical = 10-year trailing average | Forecast = upcoming 12-month
- Delivered Units: 10,333 | Historical Avg: 4,007 | Forecast: 5,389 | Peak: 10,037 (2026 Q2)
- Net Absorption: 8,027 | Historical Avg: 3,268 | Forecast: 5,177 | Peak: 8,414 (2021 Q4)
- Overall Vacancy (incl. lease-up): 10.1% | Historical Avg: 7.1% | Forecast Avg: 9.7% | Peak: 10.2% (2025 Q4)
- Asking Rent Growth: 1.1% | Historical Avg: 2.0% | Forecast: 2.4% | Peak: 7.3% (2022 Q2)
- Effective Rent Growth: -0.2% | Historical Avg: 1.9% | Forecast: 2.1% | Peak: 7.9% (2022 Q1)
- Demolished Units: 394 | Historical Avg: 95 | Forecast: 131
Absorption, Net Deliveries, and Overall Vacancy (CoStar, 9/12/2026)
Supply, Vacancy, and Concessions
- Stabilized Vacancy (excl. lease-up): 7.7%, up 80 basis points year over year
- Overall Vacancy vs. National: 210 basis points above the national average
- New Supply (12-Month): 3.9% of inventory vs. 2.3% nationally, the highest in the Midwest
- Under Construction: 7,333 units across 33 properties, 3.1% of inventory vs. 2.6% nationally
- Delivery Outlook: Around 8,600 units in 2026; forecast to decline 44% to approximately 4,800 in 2027
- Lease-Up Pace: 2025 deliveries were 79% leased at roughly 15 months, vs. 90% for pre-pandemic properties
- Supply Concentration: Upper Arlington accounted for about 20% of 12-month deliveries; Delaware County, Downtown Columbus, and Northeast Columbus about 14% each; mid-priced units made up 64% of deliveries
- Concessions: 70% of urban-core properties offering discounts (50% a year ago); roughly two months free is standard at new luxury properties
- Rent Pressure: Downtown rents down 1.3% annually; properties delivered in the past three years down 1.2% annually
- Average Asking Rent: $1,399/unit (effective: $1,341/unit)
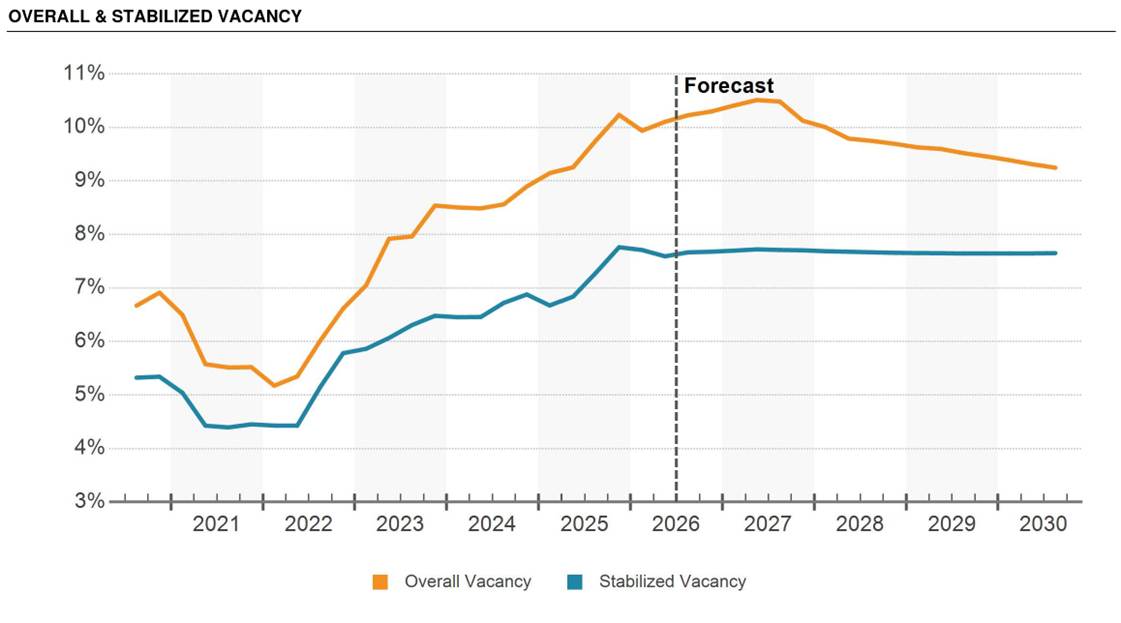
Overall vs. Stabilized Vacancy (CoStar, 9/12/2026)
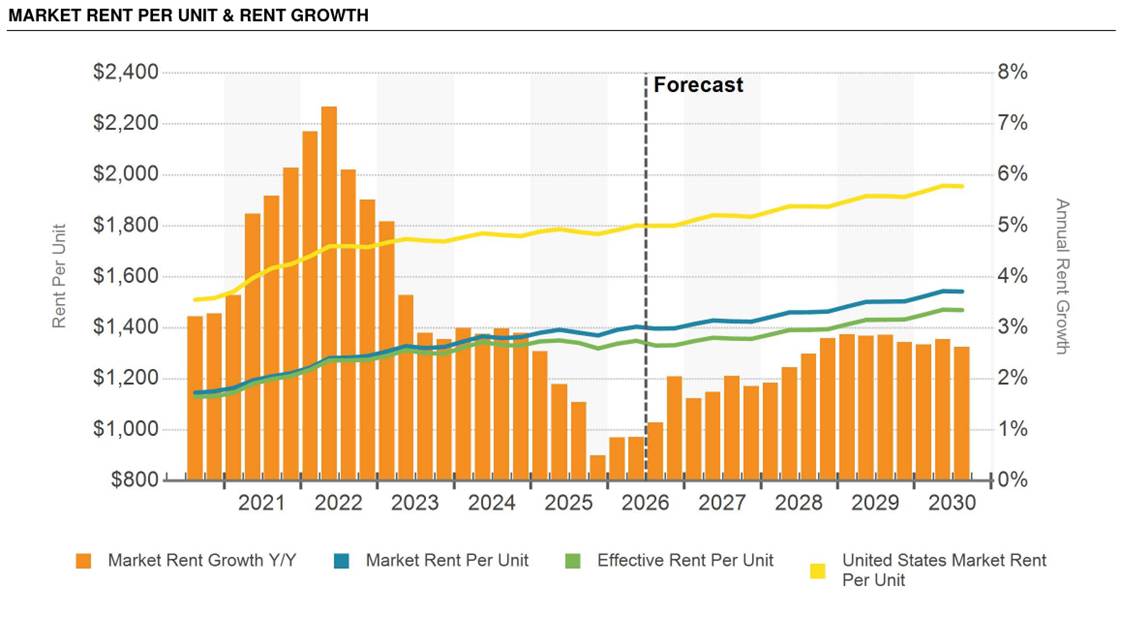
Market Rent per Unit and Rent Growth (CoStar, 9/12/2026)
By Star Class
| Metric | 4 & 5 Star | 3 Star | 1 & 2 Star |
| Overall Vacancy (incl. lease-up) | 12.4% | 9.8% | 8.6% |
| Asking Rent Growth (12-Month) | 1.0% | 1.0% | 1.6% |
| Asking Rent/Unit | $1,667 | $1,433 | $1,087 |
| Effective Rent/Unit | $1,576 | $1,371 | $1,065 |
| Units Under Construction | 2,618 | 4,715 | 0 |
| Market Cap Rate (YTD 2026) | 6.4% | 6.7% | 7.3% |
| Market Sale Price/Unit (YTD 2026) | $201,333 | $149,733 | $98,101 |
| Avg Transaction Price/Unit (YTD 2026) | $204,601 | $175,652 | $80,387 |
- 4 & 5 Star: Net absorption declined 26% year over year to 3,500 units, in line with historical norms
- 3 Star: Deliveries increased 25% year over year to 6,100 units; overall vacancy of 9.8% compares with a five-year average of 7%
- 1 & 2 Star: Net absorption of 9 units this quarter
Vacancy Rate: 3 Star, 4 & 5 Star, Columbus, and U.S. (CoStar, 9/12/2026)
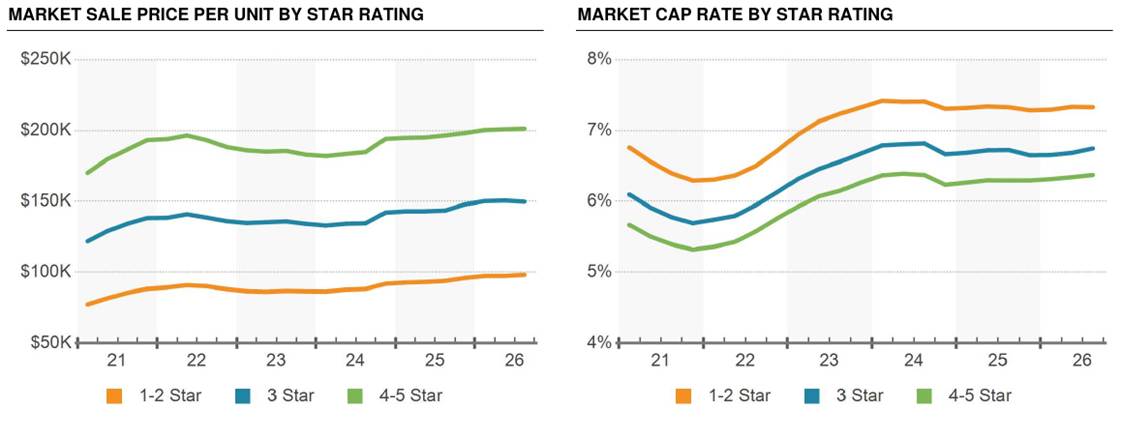
Market Sale Price per Unit and Market Cap Rate by Star Rating (CoStar, 9/12/2026)
Capital Markets Overview
- Total Asset Value: $36 billion
- 12-Month Sales Volume: $336.8M across 121 transactions, 119 properties, and 9K units (average deal: 74 units); down 59% year over year
- First-Half 2026 Volume: Around $58.2M, the lowest total over the past decade
- Market Sale Price/Unit: $147,608, up 3.8% year over year
- Average Transaction Cap Rate: 7.7% (range: 2.5% to 12.4%)
- Average Transaction Price/Unit: $37.3K (range: $17.8K to $260.4K)
- Sale vs. Asking Price: -8.1% average
- Percent Leased at Sale: 90.2% average
- Time to Sale: 4.1 months to reach a 50% probability of sale
- Buyer Mix (12-Month Volume): Institutional 44%, Private 27%, User 20%, REIT/Public 9%; national buyers 70%, local 29%
- Largest Trade: The single $130.5M sale of the Quarry Apartments (674 units) accounted for a substantial share of annual volume
- Value-Add Pricing Spread: A 71-unit Eastmoor property sold for $6.9M ($97,000/unit) at a 6.2% cap rate; a 24-unit Reynoldsburg property sold for $2.6M ($108,500/unit) at an 8.3% cap rate; North Linden and Clintonville traded in the low- to mid-5% range
- Notable Q3 Trades: Trotters Park (144 units, built 2015) sold in August 2026 for $31,465,000 ($218,506/unit) with 11.1% of the property vacant at sale; Arlington Pointe Apartments (112 units, built 1970) sold in July 2026 for $12,250,000 ($109,375/unit)
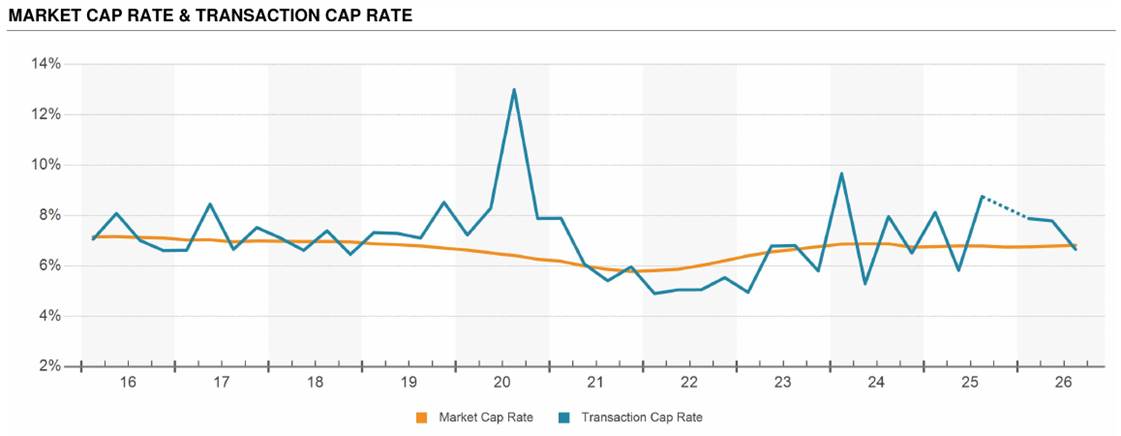
Market Cap Rate vs. Transaction Cap Rate (CoStar, 9/12/2026)
Top Submarket Sales (Trailing 12 Months)
- Upper Arlington: $152,095,000, 36 transactions, 7.1% cap rate, $161,137/unit
- Licking County: $57,860,001, 11 transactions, 7.6% cap rate, $109,751/unit
- Downtown Columbus: $41,165,000, 10 transactions, 6.3% cap rate, $236,124/unit
- Southern Columbus: $39,215,000, 10 transactions, 6.5% cap rate, $133,858/unit
Takeaways
Quarter over Quarter vs. Q2 2026
- Demand: Net absorption climbed from 6,312 to 8,027 units, the highest level in five years, while deliveries rose from 9,472 to 10,333.
- Vacancy: Overall vacancy (incl. lease-up) eased from 10.2% to 10.1%, and stabilized vacancy (excl. lease-up) fell from 8% to 7.7%. 3 Star, the class that absorbed most of the new supply, saw overall vacancy drop from 10.6% to 9.8%.
- Pipeline: Units under construction fell from 9,464 across 41 properties to 7,333 across 33. The 2027 delivery forecast moved from a 30% decline (about 5,200 units) to a 44% decline (about 4,800 units).
- Rents: Asking rent growth rose from 0.7% to 1.1% while effective rent growth moved from 0.1% to -0.2%. Asking growth improved in every class: 4 & 5 Star from 0.2% to 1.0%, 3 Star from 0.8% to 1.0%, and 1 & 2 Star from 1.5% to 1.6%.
- Capital: Sales volume slipped from $350.8M to $336.8M, the average transaction cap rate moved from 8.1% to 7.7%, the discount to asking widened from 7.8% to 8.1%, and year-over-year price growth slowed from 4.3% to 3.8%.
- Pricing by Class: The market cap rate held at 6.8%. 4 & 5 Star expanded from 6.3% to 6.4%, 1 & 2 Star compressed from 7.4% to 7.3%, and 3 Star market sale price per unit dipped from $150,268 to $149,733.
The read: renters absorbed nearly 78% of a record delivery year, and the pipeline shrank by 2,131 units in one quarter. The pressure has shifted from occupancy to effective rent. Anyone underwriting an acquisition today should build year one on effective rent with concessions carried through, not on the asking rent line.
Macro Headwinds: Rate Hike, Oil, and Two Wars
- The Federal Reserve raised its benchmark rate 25 basis points to 3.75% to 4.00% on September 16, 2026, its first hike since 2023, and signaled another is possible this year.
- The 10-year Treasury crossed 5% on September 14 for the first time since 2023. Freddie Mac’s 30-year mortgage rate averaged 6.95% the week of the Fed meeting, up from 6.76%.
- The Iran war continues without a deal. On September 22, President Trump told the U.N. he expects one after the midterms. Brent settled near $99 and WTI near $95, and diesel set a record above $6.
- On September 20, Ukraine launched its largest-ever drone attack on Moscow, damaging the Moscow Oil Refinery.
- Net effect for Columbus: the metro is not oil-dependent, but it is rate-sensitive. With the 10-year near 5%, debt cost sets the ceiling on price, and loan sizing, not the seller’s cap rate, decides what a deal can support.
Sources
Real Estate Data sources from CoStar
- CoStar Group, Columbus – OH USA Multi-Family Market Report (9/12/2026)
- CoStar Group, Columbus – OH USA Multi-Family Capital Markets Report (9/12/2026)
- Federal Reserve Board, FOMC Statement, September 16, 2026
- CNBC, Fed rate decision September 2026
- Fortune, Fed rate hike and housing borrowing costs
- Yahoo Finance, mortgage rates after the Fed hike (Freddie Mac data)
- CNBC, oil and Iran talks at the U.N.
- The Hill, oil prices and the Iran war
- AP via U.S. News, Ukraine drone attack on Moscow